To Facility Managers Who Sign GWT Reports:
You hold API 570 certification. Many of you were once UT inspectors yourselves. You understand what a proper inspection report looks like — because you have reviewed PAUT scans, ToFD images, and shear wave UT records that document signals at specific positions along a weld circumference.
Then you receive a GWT report. One page. 200 feet of pipeline. A log-scale or linear scale amplitude plot with a DAC curve.
A table of geometric features — welds, supports, flanges — inserted by the inspector from visual observation of the pipeline.
No detailed signal image of any section of pipeline. No noise floor stated. No SNR documented per indication.
You sign it.
want to ask you directly: if you removed the one-page long-range GWT plot entirely and replaced it with a photograph of the pipeline, would the report contain any less verifiable information than it does now?
The answer is no — because the one-page DAC-curve plot cannot be independently verified by any qualified UT inspector reviewing the report. The amplitude values cannot be checked without knowing the noise floor. The inspection range cannot be confirmed without checking the background noise level. The coupling quality — whether the probe made adequate contact with the pipe surface — is invisible on a one-page plot covering 200 feet.
If you've been signing these without noticing this gap, you're not alone — most facility managers were never shown what a per-indication GWT report should look like, because so few inspection companies produce one.
That gap drives what follows. Without anyone asking for more, the inspection company has little reason to invest in better equipment, better training, or proper signal analysis. The inspector learns to finish the report in the field without reviewing signal detail. The standard drops. The next contract is won at an even lower cost.
This is a pattern that has run in GWT for 20 years. You are not the only cause — but you are the one with the authority to stop it.
The next time you receive a GWT report, ask one question before signing: "Can you show me the detailed signal image of any one meter of this pipeline?"
If the answer is no, there's no way for you to know whether the inspector actually reviewed the signal at each section — or simply built the report from the pipeline drawing and a walk-through.
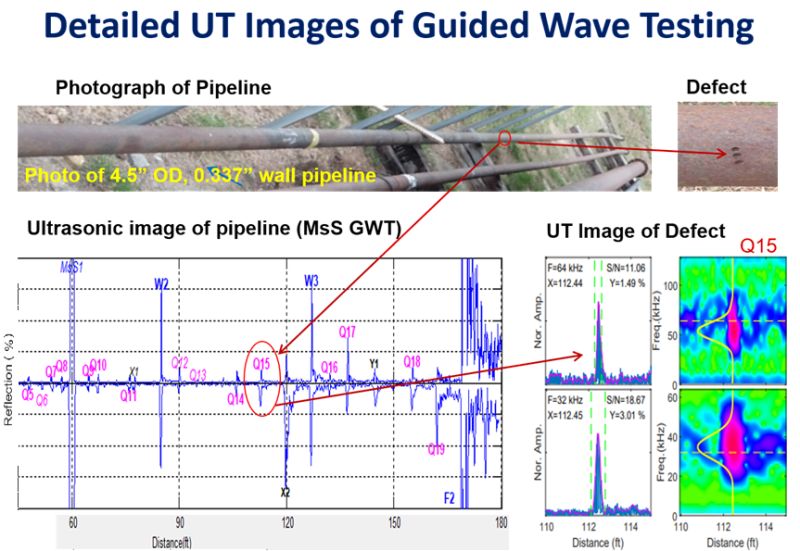
The image below shows what that detailed signal actually looks like: the pipeline photo, the physical defect, and the corresponding MsS GWT signal — calibrated to % reflection coefficient with a TCG plot, so the noise floor and SNR at that specific indication are directly visible.