
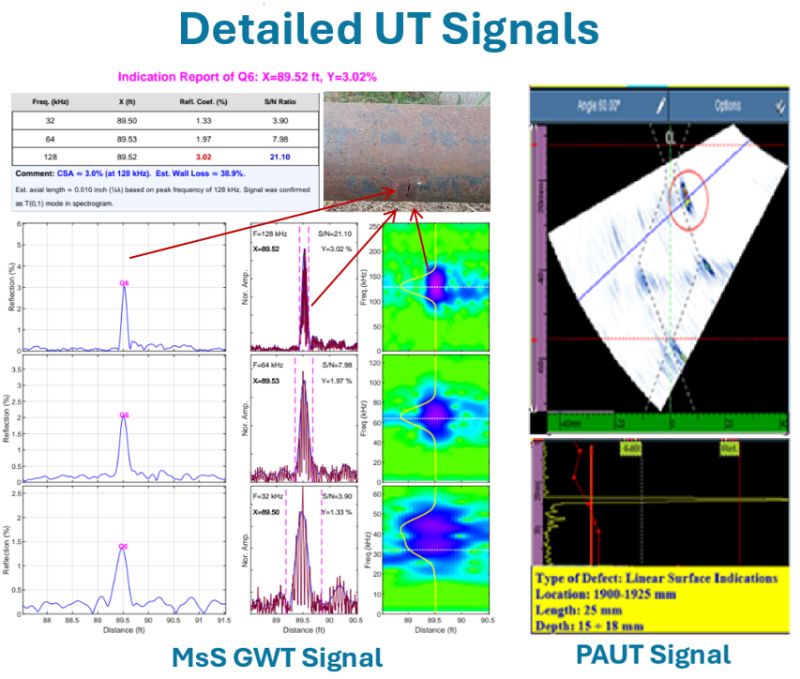
This is what detailed GWT and PAUT signals look like side by side — the documentation missing from every one-page GWT report.
Indication Q6 at 89.52 feet. Reflection amplitude: 3.02%. The left side shows the MsS GWT per-indication signal at three center frequencies (128, 64, and 32 kHz). Each frequency shows the amplitude signal and spectrogram confirming T(0,1) mode identity. SNR ranges from 3.9 to 21 — all well above the 2:1 minimum threshold. The photograph below shows the actual corrosion found at this location.
The right side shows PAUT confirmation at the same location: linear surface indications, 25mm long, 15 to 18mm deep.
This is what GWT evidence looks like:
- Per-indication signal at multiple center frequencies
- SNR documented for each frequency
- Spectrogram confirming T(0,1) mode with vertical line — not flexural, not longitudinal, not reverberation
- PAUT confirmation of actual defect dimensions
Now the question I ask every GWT contractor:
"Can you show me this level of documentation for any single indication in your last GWT report?"
In 20 years of many GWT reports — one-page DAC-curve plots for 20 to 300-ft length, indications classified as Minor/Medium/Severe without stated amplitude, no spectrogram, no SNR — not one has shown this.
This is the main reason that many UT inspectors do not believe the findings of GWT. The one-page DAC-curve plots is no evidence of wave mode confirmation, no clear indication and noise signal to check signal-to-noise ratio, and no amplified signal width for checking spatial resolution.
The PAUT data at each weld location along the pipe circumference and at each angle is UT A-scan data. The GWT data at small section of pipeline is also UT A-scan data. I believe that UT inspector can find defects in any UT A-scan data by checking signal-to-noise ratio and spatial resolution. The main problem of GWT for 20 years is that the report does not show this UT A-scan data. That is why UT inspectors ask to GWT inspectors that "do you find any indication by looking at the detailed UT signals?" If you do, why don’t you report them so that any UT or API inspector can check your finding?
GIM software generates this documentation automatically for every indication in every report. This is not advanced analysis. This is what GWT evidence should look like as a minimum standard.
NDT Canada 2026 paper NDT Canada 2026 paper.
Video: GWT Reporting Reform: A New Per-Indication Framework for GIM Software | NDT Canada 2026