
UT Shear Wave vs. MsS Sector Probe — What Changes When You Lower the Frequency?
Guided Wave Testing (GWT) is not fundamentally different physics. It is ultrasonic testing at lower frequency with a larger aperture probe.
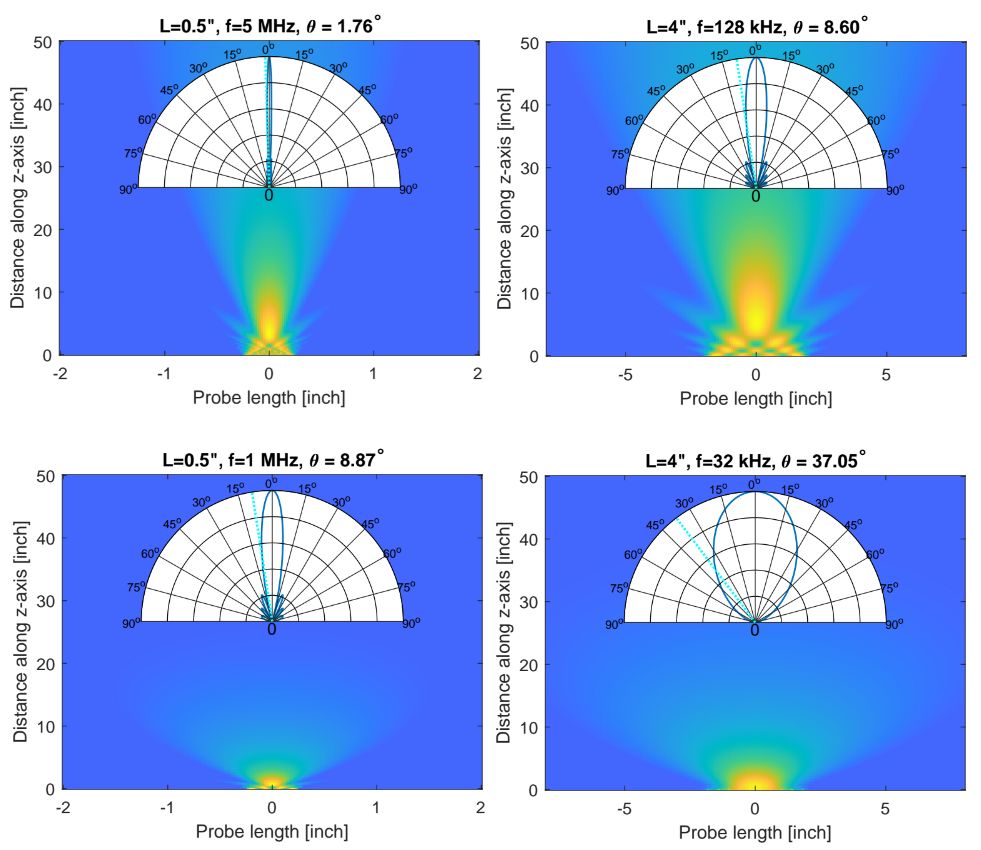
The following all four cases use steel with shear wave velocity v = 3251 m/sec (128 inch/msec), linear aperture, -6 dB half-angle criterion.
- Case 1 — UT: 5 MHz, 0.5-inch probe → θ = 1.76° | Near field: 3.3 inch
- Case 2 — UT: 1 MHz, 0.5-inch probe → θ = 8.87° | Near field: 0.6 inch
- Case 3 — MsS 128 kHz, 4-inch probe → θ = 8.60° | Near field: 5.3 inch
- Case 4 — MsS 32 kHz, 4-inch probe → θ = 37.05° | Near field: 0.5 inch
Cases 2 and 3 show nearly identical beam divergence — one at 1 MHz UT, one at 128 kHz MsS. Both have λ/D ≈ 0.25. Same ratio → same beam behavior. Different frequency, different aperture, same physics.
The larger MsS aperture compensates for lower frequency — maintaining directional beam control for targeted inspection of pipe supports, touch-point corrosion, soil-air interfaces, pressure vessels, and thick plates. For touch-point corrosion we recommend 90-128 kHz for higher spatial resolution and tighter beam angle.
An invitation to UT Level 2 and Level 3 inspectors:
If you understand beam divergence, near field length, spatial resolution, signal-to-noise ratio, and amplitude calibration in UT — you already understand GWT. The transition is a step down in frequency and a step up in aperture. Same physics as moving from shear wave UT to phased array.
GWT is low-frequency UT. The same signal quality and documentation standards must apply.
If you are a UT Level 2 or Level 3 inspector who has ever reviewed a GWT report and wondered why it looked nothing like a UT report — you already know what needs to change. It is because nobody ever asked for a detailed signal image for each indication or geometric feature. That habit — more than 20 years old — has allowed GWT reports to replace per-indication UT signal documentation with written summaries and visual observations.
Who can find an indication without looking at a detailed signal image? Who can trust a report that does not include a single per-indication signal plot?